
Study Design
last authored:
last reviewed:
Introduction
It is rarely practical or possible to measure every single member of a population, and as such a random sample is drawn from the population of interest.
Normally, the sample mean should equal the population mean. If it does not, it could be due to:
- random variation within a normal distribution. The standard error of the mean is useful in determining this.
- a particular sample could be different from the general population, either due to selection bias or purposeful choosing.
Z tests allow determination of whether the difference is true or not. T tests can be used instead if n is less than 30. Different curves are used because with smaller samples there is more of a chance for error or variance.
Levels of Data
There are various levels of data. Samples are always estimates of the whole population, and this introduces error.
Types of Study
- experimental studies
- observational studies
Experimental Studies
- prospective trials that are preferably randomized, controlled, and blinded
- usually use 'intention-to-treat' analysis
- limitations: subjects or conditions may not reflect the 'real world' and be of limited applicability
- cross-over studies can allow subjects to act as their own controls - ensure proper wash-out period
- n of one trials
Observational Studies
Observational studies are not a real experient; one just watches what happens. These can identify associations, but causation needs to be shown through experimentation.
cohort
- normally prospective, or longitudinal
- starts with known exposure status and follows subjects over time to find disease outcomes
- good for studying rare exposures, estimates of timing
- selection of control group identical except for the things of interest is very difficult
- often expensive, costly, and suffers from participant loss
case-control
- starts with 'known' cases and controls and a number of potential casuative factors
- retrosepctive;
- very good for examining exposure history
- useful for rare diseases or long intervals between exposure and disease
- relatively quick and inexpensive
- high risk of recall bias and can be difficult to select appropriate controls
cross-sectional
- examines potential exposire at one point in time
- usually administered by survey
- limited usefullness except for looking for associations
ecological
- examines populations rather than individuals and deals with comparisons of rates
- used in preliminary stages of cancer research
- beware 'ecological fallacy'
unsystematic clinical observations (case series, case reports, personal opinion)
- interesting, but of limited value
Sample Size
A trial should be big enough to have a high chance of detecting a worthwhile effect if it exists and this be reasonably sure it doesn't exist if it is not found.
Factors Determining Sample Size
Level of clinically significant effect
A clinically significant difference in outcomes is not the same as a statistically significant difference. For example, a decrease in blood pressure of 10 mmHg could be statistically shown to be due to a given treatment but have limited impact on a patient's risk of cardiovascular disease.
A statistical nomogram can be used to determine the number of subjects required to demonstrate an effect, if it exists (the power of a study).
The Power of a Study
The power of a study is the ability to demonstrate an association, if it exists, thus representing the capacity to avoid β (type II error), or 1- β.
Power is determined by:
- frequency of the condition being studied
- magnitude of the "effect"
- anticipated variance
- chosen α level
- sample size
Underpowered studies are very common, usually because of difficulties recruiting patients. This often leads to a type II, or β error, which erroneously concludes that an intervention has no effect.
Small, "underpowered" studies are less likely to find a real difference as significant.
Beta, and accordingly power, should be fixed at the time of study design to determine optimal sample size; a sample size calculator can be of use when doing this.
A useful exercise is to select 'compare proportions for two samples' and to alter the p1 and p2 or the power and observe effects on required sample sizes.
Types of Data
Data is collected from an experimental population and is compared with the control population to test the hypothesis. Statistics allow us to test how unlikely it is that observed data does not come from the normal distribution of the control population.
categorical
- dichotomous
- nominal - names or classes (ie ethnicity)
- ordinal
numerical
- discrete
- continuous
- interval - equal spaces between measurements
- ratio - has a true zero
Dependent variables can be either continous or dichotomous, and the statistic test used depends on the type of data of the independent variable.
continuous dependent variables
statistical tests used:
- t-test - two independent variables
- ANOVA - more than two independent variables
- linear regression - continuous independent variables
- correlation - continous independent variables
dichotomous dependent variables
statistical tests used:
- Chi-square and Fisher's exact test - normally 2x2 tables
- logistic regression - any independent variable(s)
survival analysis
As participants can enter or leave studies at different time points, uneven observation periods are common with survival analysis. Person-time date can be used, but it assumes 1 person for 10 years is equal to 10 people observed for 1 year, which is not likely true.
More specialized tests include
- life table analysis - divides the observation interval into smaller periods and estimates probability for each
- Kaplan-meier curves - similar except that intervals are very small, and exact survival time is used
- Cox proportional hazards regression - predicts the time to outcome by comparing Kaplan-Meier curves while controlling for other variables; yields hazard ratios that can be interpreted as adjusted RRs.
Testing the Hypothesis
In order to determine differences between samples and populations, null and alternative hypotheses are formed.
Normally, the null hypothesis is meanE - meanC = zero. There is no difference between groups.
A rejected null hypothesis suggests the result is statistically significant, if it is unlikely to have occurred by chance.
A test statistic gives a p value. Set the p value where you'd like. If a p value is 0.05, it means there is a 5% chance that the difference could be false.
- A conservative alternative hypothesis simply states that the experimental mean will be different than control mean, without predicting a direction. As such, a z score or two-tailed t-test is used.
Errors
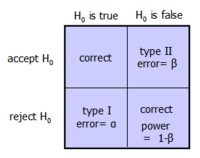
Type I error: finding a difference (rejecting the null) when there is none. P value-mediated.
Type II error: failing to find a difference (accepting the null) that exists; Power is the capacity to find a difference, and is therefore 1- β
Resources and References
 |