
The Heart as a Pump
last authored:
last reviewed:
Introduction
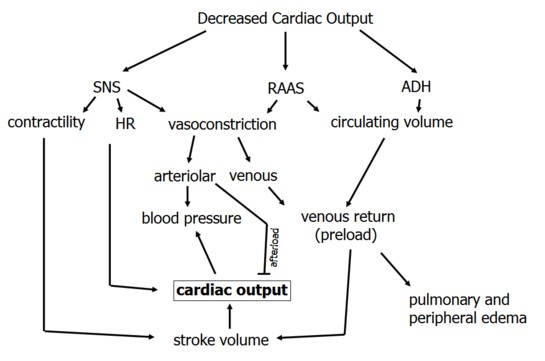
cardiac output =
stroke volume x
heart rate
The heart pumps in a pulsatile fashion. A complete cardiac cycle involves the contraction of the two atria followed by the contraction of the two ventricles. This rhythmic cycle is controlled by electrical signals and pathways of the heart, described here.
Cardiac output is the measure of how effectively the heart is doing, and is the product of stroke volume x heart rate.
Systole and Diastole
Systole is the contraction of the left and right ventricles, resulting in blood flow to the body and lungs, respectively. Diastole is the relaxation and filling of the ventricles. Blood passes from the atria into the ventricles across the open tricuspid and mitral valves, causing a gradual increase in ventricular pressure. In late diastole, atrial contraction pushes a further amount of blood into the ventricles.
Ventricular systole lasts about 0.3 seconds, while the remaining 0.4 seconds represent diastole.
S1 and S2 are normally heard during systole.
The duration of systole remains constant from beat to beat, while the length of diastole varies with heart rate.
Stroke Volume
Stroke volume =
end diastolic volume -
end systolic volume
Stroke volume (SV) is normally approximately 70 ml. (note: it would be nice to have a picture of 70ml). Stroke volume is calculated by end diastolic volume (EDV; the amount of blood in the ventricles just before contraction) minus end systolic volume (ESV; the amount of blood remaining just after contraction).
Atrial systole adds perhaps 5% to ventricular stroke volume.
Stroke volume is increased by contractility and preload, and decreased by afterload.
Preload is the ventricular wall tension at the end of diastole, approximated by end diastolic volume (EDV).
Afterload is the vetricular wall tesion during contraction, equalling the resistance that the heart must overcome. It is approximated by systolic pressure.
The ejection fraction is the percentage of blood ejected; ie 70/120. It is normally 55-75%.
Left-sided heart failure results in decreased stroke volume. This, in turn leads to increased pulmonary congestion, decreased right sided stroke volume, and venous congestion.
Regulation of Cardiac Output
The Frank-Starling Mechanism
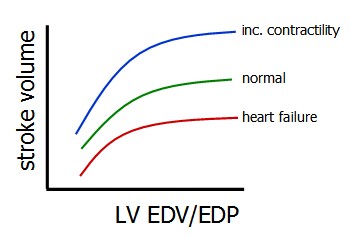 The Frank-Starling Mechanism states that the heart will pump all blood returned to it, within physiological limits. Accordingly, as the graph at left shows, increasing end diastolic volume will result in increased stroke volume.
This is true during normal periods, during times of increased contractility, or during heart failure.
Increasing contractility (inotropy) results in increased stroke volume and decreased ESV, shifting the ESPVR line upwards.
If preload and therefore EDV is increased, the Frank-Starling mechanism will increase stroke volume such that ESV remains the same.
If afterload is increased while keeping preload the same, however, smaller stroke volumes and increased ESVs will ensue. There is a linear relationship between afterload and ESV termed end-systolic pressure volume relation (ESPVR).
Decreased contractility causes an increase in ESV, and increased venous return will therefore also increase EDV. The Frank-Starling Mechanism will kick in to regulate this by elevating stroke volume as much as possible.
Decreased compliance decreases EDV, leading to decreased stroke volume.
Determining Cardiac Output Using the Fick Method
The Fick Method of determining CO states that oxygen concumption is related to oxygen removal from blood as it flows, such that
O2 consumption (ml/min) = O2 removed (ml/min) x blood flow (ml/min)
or
O2 consumption (ml/min) = AV O 2 difference x CO
Measuring O2 consumption in expired air, and sampling arterial and venous blodd, will provide a measure of CO.
Pressures throughout the Heart
While pressures are different between the right and left heart are very different (6x), the volumes they pump are the same.
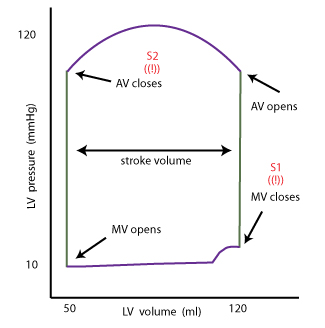
The LV sees are huge change in pressure throughout its action, ranging from 10 - 120 mm Hg.
The increase in volume just before closure of the mitral valve is due to atrial contractrion, which contributes 5% of ventricular volume. This therefore corresponds to the P wave.
Resources and References
 |